MY STORY
Growing up, I was always an avid sports fan. At the age of 10 - proudly wearing my Eddie George jersey - I really thought I was going to become the first female NFL player. The love of sports (especially football) never left me…it only grew. Whether drum major for my high school marching band or a tutor for Western Kentucky University’s (WKU) student-athletes, I’ve always stayed within close proximity to sports.
I received my B.A. in History, Social Studies, and Secondary Education from Western Kentucky University (2013). After student teaching, I realized that my strengths and interests resided in the planning and creation of materials rather than actually teaching. Not wanting to waste any time, I began pursuing my Masters in Instructional Design. By 2015, I had received my Masters and was working full-time at WKU as an instructional designer.
Although my 5’2” self had to accept the reality that my stature did not lend itself to football, I was able to find outlets through which I could creatively express my passion for the game after work hours. What began as a WKU fan blog eventually segued into a contribution gig with InsideHilltopperSports.com (WKU site for Yahoo Rivals network). After a couple years of writing - and during WKU’s uncharacteristic 3-9 season (2018) - I decided to take a new approach to my per game analysis.
I wasn’t satisfied with writing the obvious. It felt like context and an acknowledgment of football’s complexities was missing. Having seen Moneyball, I began researching the equivalent for football. During that research, I stumbled upon Bill Connelly as well as cfbfastR (formerly cfbscrapR). Absorbing whatever I could, I simultaneously taught myself advanced football analytics and coding in RStudio. And thanks to retweets from the football analytics community, as well as several WKU Football staff members and assistant coaches, my Tweets, work, and blog gained a modest exposure.
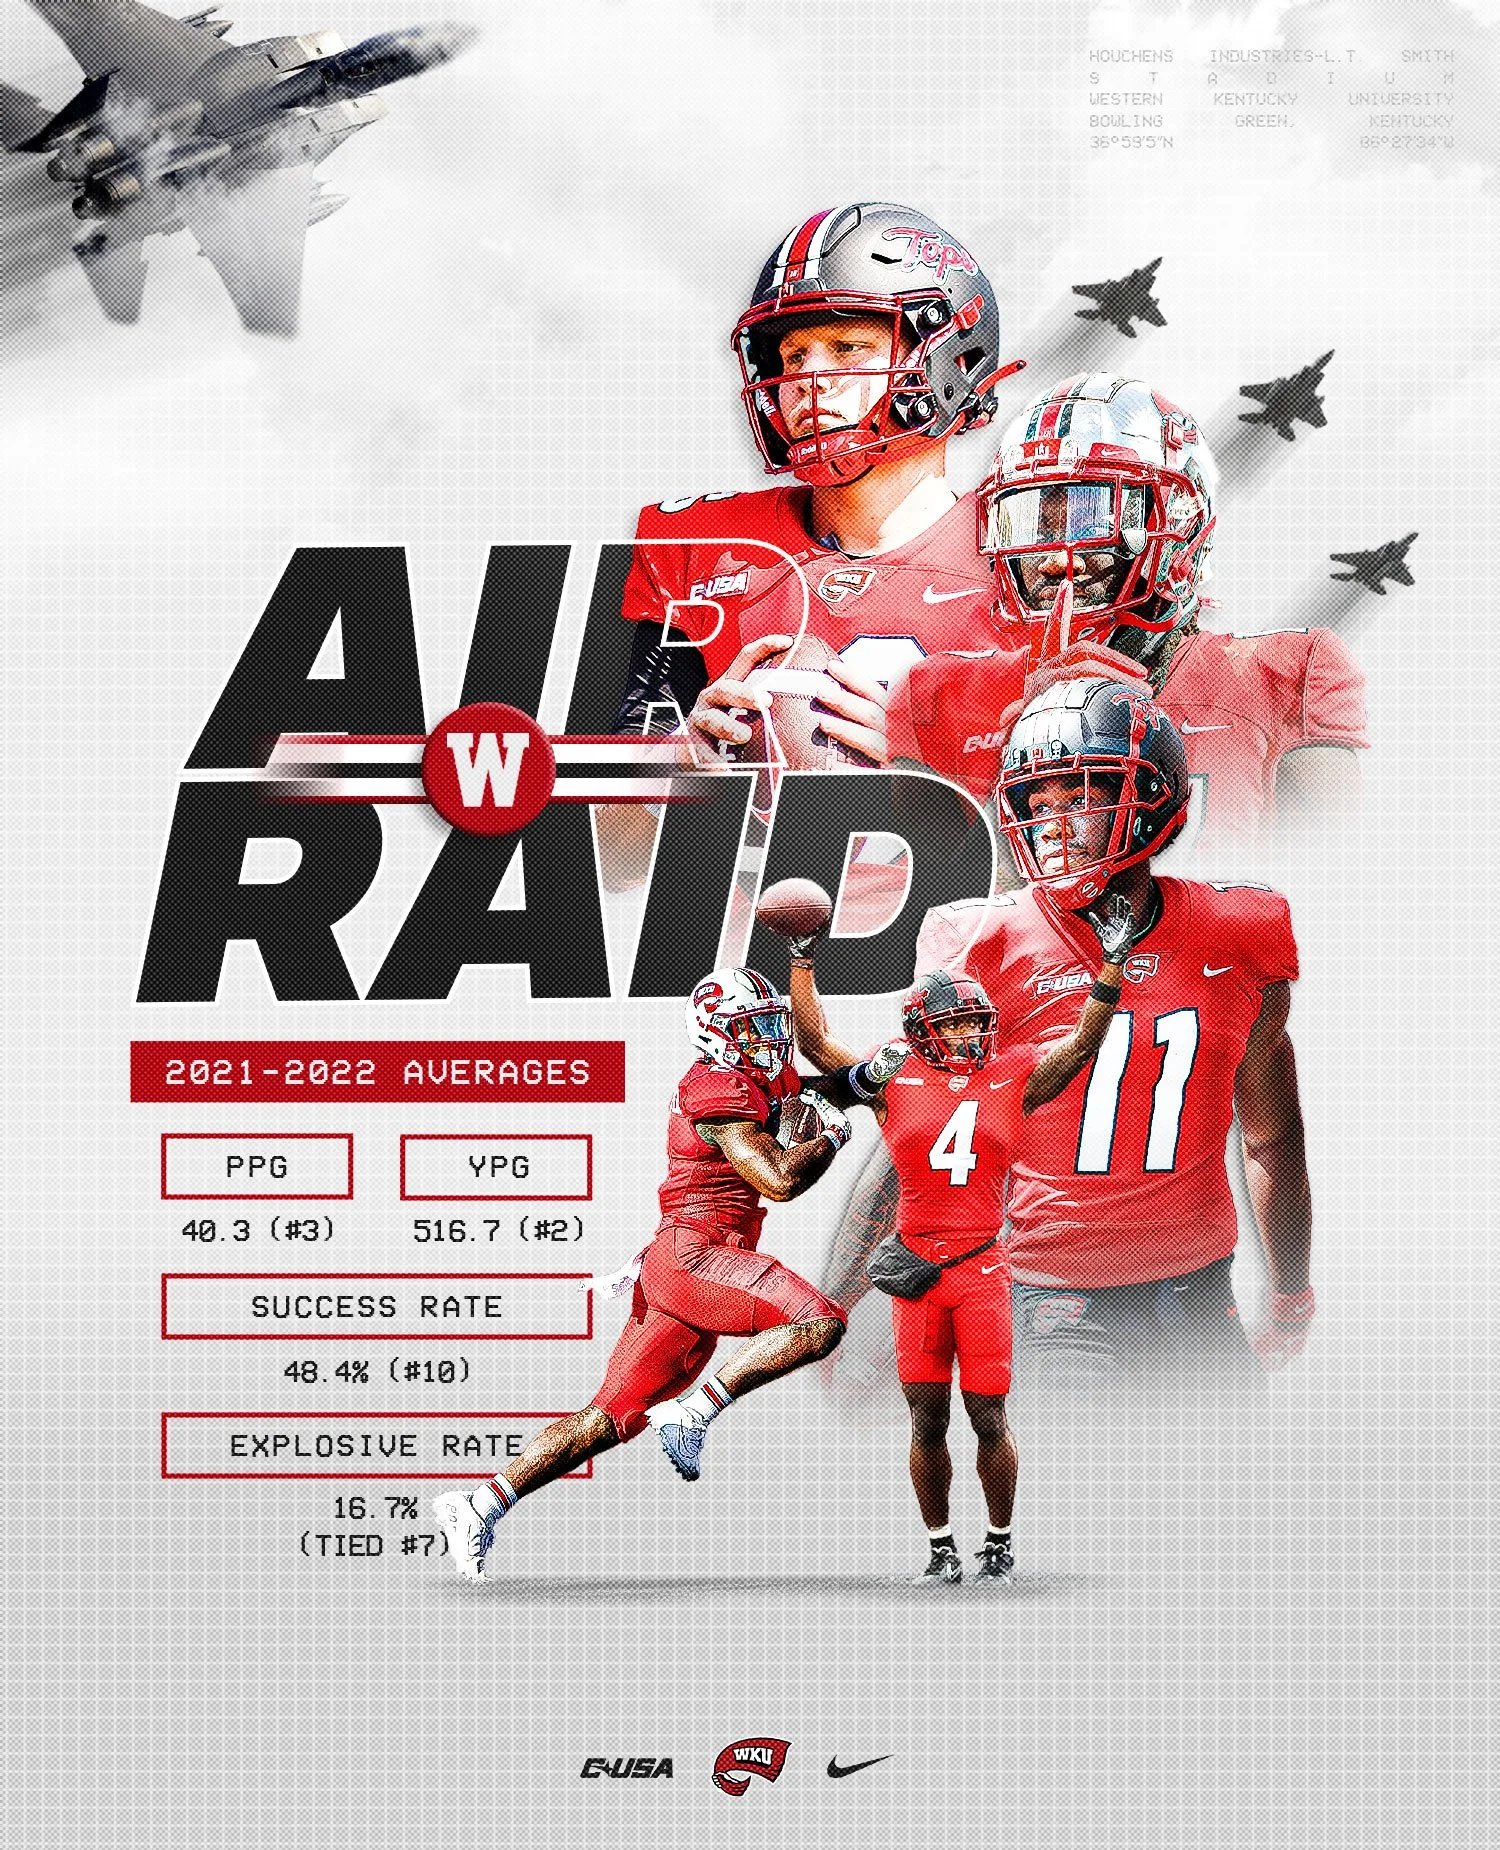
While stats are relatively new to my repertoire, I have always been creatively-inclined: drawing/painting/sketching, knitting, playing piano and french horn, sewing, taking pictures, etc. I’m a utility player…a Jack of all trades…and that can cause some confusion when I explain my interests to people. Graphic design and photography go hand-in-hand. But how and where do stats fit in? Easy. Who says you can’t creatively illustrate advanced analytics and statistics?!
Each interest can stand alone. But I truly believe that the three together - graphics, photography, and stats - could be a powerhouse combination that sets a team apart from the rest.

